Home and property values across the country have generally climbed since 2020, a product of a myriad of economic issues, interstate migration, and more. The result has been growing pains for states that have historically had low property tax levels.
Americans’ property tax bills increased an average of 4 percent in 2023; but, it is all relative. The growing pains are disproportionate in states those low-tax states, where property tax collection has paced with skyrocketing home values. Taxpayers – voters –, feeling the pinch of as-high-as 40 percent property tax increases in some Rocky Mountain communities (despite non-coastal Western states ranking in the bottom half of effective property tax rates in the nation), are understandably concerned about their tax bills. In response, state legislatures have taken action to mitigate steep increases that dings home affordability.
Property tax policy changes rooted in exemptions and calculation revisions tend to disproportionately impact special districts that rely more heavily on property tax revenues, have a small or no base for user fees, and are unable to collect sales tax – especially those providing fire protection, ambulance/EMS, mosquito abatement, drainage and flood control, library services, and others that are less able to establish user fees as a revenue base.
Special districts are already set on an uneven playing field to access various pots of federal funding. Some state-level property tax decisions have made this situation even more imbalanced – especially when school districts are afforded breaks to cushion the negative impacts of state-driven property tax modifications. Democrats and Republicans alike are leading these charges.
For the purposes of this article, AASD – through our partnership with GovFin and Karr Advocacy Strategies rooted in better understanding and sharing America’s special districts’ story through data – we focus on Colorado, Idaho, and Missouri.
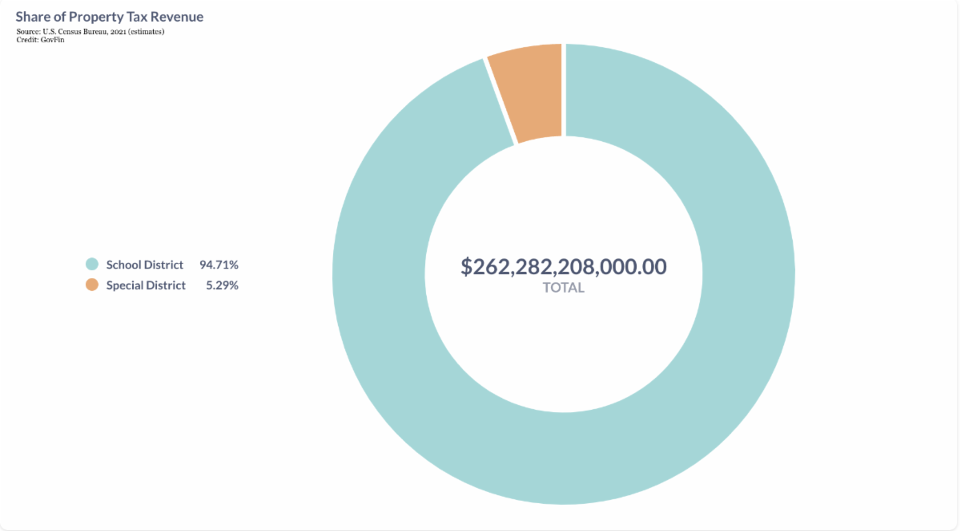
First – it is important to note the shear difference in reported property tax collection between special purpose districts that provide school/education services vs. those that provide specific/limited critical infrastructure and other non-educational essential services.
The 2022 Census of Governments (COG) counted 51,101 special purpose units of government across the nation. Among those, 75.5 percent are non-educational districts (we know them generally as “special districts”), but the same figures indicate these non-educational special districts glean only 5.3 percent of the “universe” of special purpose governments’ property tax collection. This is based on a sampling of local governments during FY21, the year which the U.S. Census Bureau collected the data prior to the full COG. (Full figures are expected in October or November 2024.)
Looking at the states in question where property tax pressures have been among the highest and/or where state legislatures have taken respective steps to protect relative home affordability in their states – these trends are no different.
Colorado
Colorado Governor Jared Polis, a Democrat, signed SB 24-233 in May 2024, which slows the rate of property tax increases in the state and ease pressures in counties like Garfield – the community experiencing the 40 percent increase mentioned above, in the state with the third-lowest effective property tax rate in the nation.
Even further, Colorado voters will vote on Propositions 50 and 108 in November 2024, which would, respectively, further lower assessments across the state and set a cap of 4 percent increase property tax collection growth
The state legislature introduced and passed the bill over the course of four days ahead of the end of the session. This, following a rapid-pace commission report to study property tax issues and perplexities facing Coloradans.
The result was a complicated property tax restructuring to take place over 2024, 2025, and then become more permanent beginning in 2026. Non-residential property tax rate caps will be reduced across the board from 27.9 to 25 percent from 2024 to 2026. But the residential rate caps, exemptions, and approach to backfill that may place many special districts on an even lesser plain to access revenues to provide quality, reliable services in their communities.
Under SB 24-233, Colorado’s special districts, county, and city governments will be subject to 10 percent up to $70,000 in home value (not assessed value) exemptions toward calculations beginning in 2026 – a policy that will not apply to school districts. Further, while residential assessment rate caps increase over the course of three years for all units of government, non-school local governments will be capped at 6.95 percent vs. school districts’ cap at 7.15 percent.
On its face, the decision is a win for property owners – especially for those with children – and, to a comparatively more extensive degree. In fact, the Colorado Education Association lauded the bill as a win for property owners while safeguarding education funds.
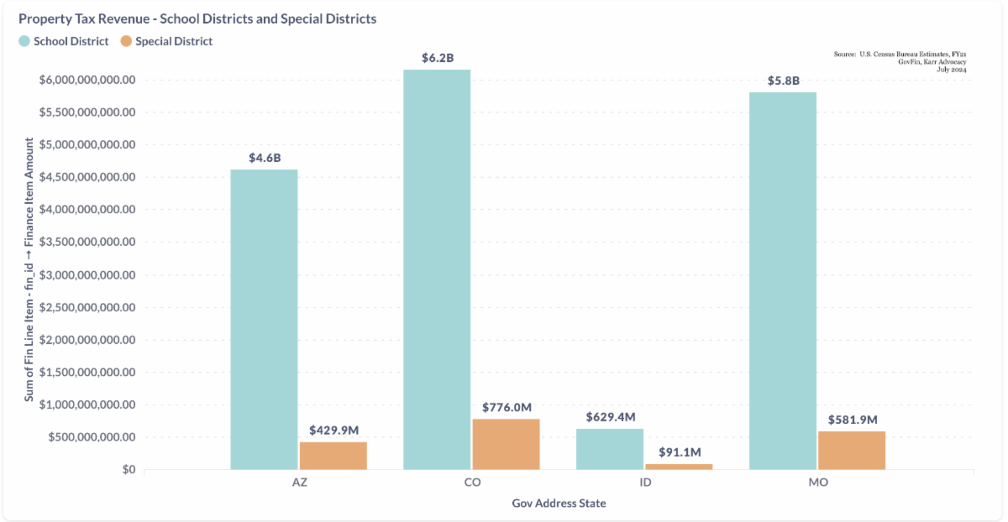
For special districts, however, this is a different story, as the policy carries disproportionate impacts for Colorado’s districts. Using the same dataset as above to look under the surface, we see how the property tax break will further Colorado’s school districts, which already have a solid property tax base for their services – gleaning eight times in property-based revenues than that of all special districts.
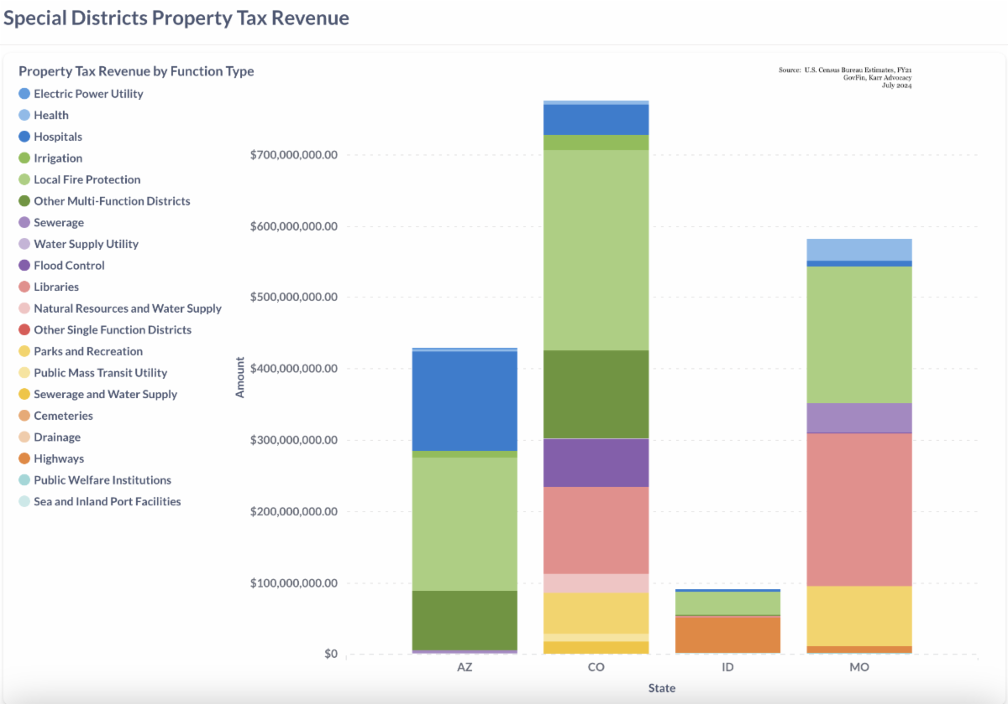
Examining the spread of property tax revenues among district types in Colorado are distributed, based on the FY21 Census-reported data set cited above – more than 60 percent of the $776 million in property tax revenues were distributed to districts providing critical infrastructure and essential community services such as fire protection, library, and flood control – traditionally more reliant on property tax revenues.
These districts are likely to feel disproportionate impacts especially in the state’s communities that are more rural, with older permanent populations, and even among high-tourism areas demanding its own need for special district-provided services.
Colorado’s special districts have yet to experience the true impacts of this policy, as the tax changes will take effect beginning with the 2024 tax year.
Missouri
Meanwhile, some states are taking patchwork approaches to addressing property tax concerns. The Missouri General Assembly passed and Governor Mike Parson, a Republican, signed Senate Bill 190 in 2023, giving counties the opportunity to freeze property taxes for homeowners that are eligible for Social Security benefits, which begins at age 62. This had to be clarified in 2024. The policy and how to do the math remains fuzzy to special districts across the state.
Around 1,900 special districts have the potential to directly impact everyday life for nearly all Missourians, as every corner of the state is covered by at least a soil and water conservation or library district.
Property tax play a significant role to ensure affordable, reliable public services are delivered across the state. A staggering 71.5 percent of property tax revenues were allocated among special districts in Missouri that are heavily dependent on their property tax base – with 114 library districts, 450+ fire and ambulance districts, and 400+ highway/road, and 180+ flood control districts taking the lion share of all property tax distributions.
According to Census figures, 18 percent of Missourians are over age 65. Another 6.8 percent are in the 60-65 age group and plus 6.6 percent of Missourians in the 55-60 age group.
Special districts providing services in predominately older communities – such as Hickory County, where the median age is 56 years-old, 37 percent of the county’s population is over the age of 65, and 16 percent is under the age of 18 – are now subject to the vote of an entire county on whether the freeze is implemented with a greater impact on emergency services, library services, and others in the area.
Property tax conversations continue in the Missouri Capitol. Lawmakers during the 2024 session weighed without conclusion whether to restrict how much counties may collect in additional property tax at 2 percent annually. For comparison, Missouri’s benchmark “Hancock Amendment” sets a 5 percent cap on tax increases otherwise before triggering a question for voters.
This trend and ongoing discussion in Jefferson City signal a clear need for the Show-Me-State’s special districts to begin rallying around protecting their primary sources of revenue and telling the story of their significance.
Idaho
Perhaps one of the most egregious of imbalanced offenses to special districts’ property tax revenue base is playing out in Idaho.
The Idaho legislature passed and Governor Brad Little, a Republican, signed HB 389 in 2021, which, among other provisions, set a 3 percent limit on an annual increase to a special district, city, and county’s budgeted property tax line item; and 8 percent cap in the case of growth. And Idaho is certainly growing – the Gem State has experienced an estimated 9.5 percent population boom since 2020.
School districts are not subject to these limits. Yet, FY21 federal data shows Idaho’s school districts took in nearly seven times the property tax revenue distributed among the state’s special districts. More than 93 percent of special districts’ property tax distributions are responsible for the funding of 150+ fire districts, 60+ highway/road districts, 55+ library districts, and 50 or so drainage/flood control districts. In all, around 800 special districts provide services across Idaho compared to 118 schools, according to Census figures.
With inflation rising, many of these Idaho districts are beginning to feel the squeeze and are expressing concern about the years ahead as growth, in some cases, are leading demand outpacing the supply of service – especially among emergency response agencies. Unlike cities and counties, fire districts are unable to supplement or offset funding from external agency departments – placing these districts on a tighter rope.
Districts’ Need for Advocacy
Unlike in Colorado and Missouri, Idaho’s special district are beginning to be able to demonstrate the impacts and projections of further impacts as the result of HB 389. Idaho’s various special districts have an opportunity in the coming 2025 legislative session, and beyond, to band together for a stronger, louder voice toward a common and inclusive policy fix.

Data analysis provided in by GovFin. For more, visit www.govfin.io and check GovFin’s LinkedIn page here.
Like what you see here? Curious of other special districts’ figures and statistics? Please let us know! Send in your questions on special districts’ metrics. Email your questions to contact@americasdistricts.org.
